
In the intricate world of Forex trading, technical analysis stands as a cornerstone for traders seeking to predict market movements and make informed decisions. Unlike fundamental analysis, which delves into economic indicators, company performance, and geopolitical events, technical analysis concentrates on price movements and patterns, providing traders with visual and quantitative tools to navigate the volatile Forex market.
Technical analysis is fundamentally rooted in the belief that historical price movements tend to repeat themselves. This assumption allows traders to predict future market behavior based purely on past price action. Central to technical analysis are charts, patterns, and indicators, each serving a distinct purpose in the trader’s toolkit.
The Essence of Technical Analysis
Charts are the most basic tools in technical analysis. They provide a visual representation of price movements over time. Forex traders typically use line charts, bar charts, and candlestick charts. Among these, candlestick charts are particularly popular for their ability to convey detailed information about price action through the shape and color of the candlesticks.
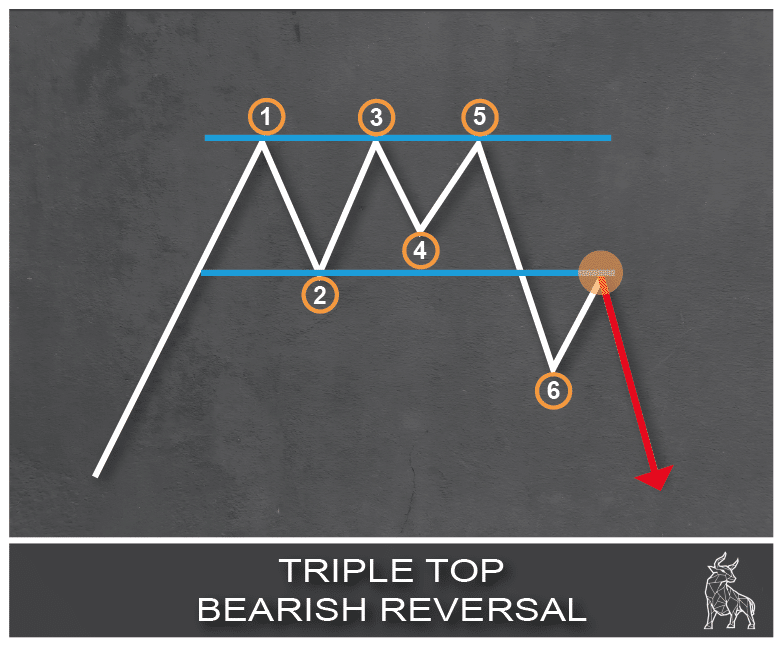
Patterns within these charts help traders anticipate future movements. For instance, formations such as head and shoulders, triangles, and flags are critical in identifying potential reversals or continuations in price trends. For example, a triple top pattern often signals a bearish reversal, suggesting that the upward trend is losing momentum.
Indicators provide quantitative insights that complement the visual analysis of charts and patterns. Some of the most widely used indicators include moving averages, Relative Strength Index (RSI), and Fibonacci retracements. Moving averages smooth out price data to identify the direction of the trend, while RSI helps determine overbought or oversold conditions. Fibonacci retracements, on the other hand, are used to predict potential support and resistance levels by measuring the vertical distance between points on a chart.

Application in Forex Trading
In today’s volatile trading environment, technical analysis offers Forex traders the structure and discipline required to make informed trading decisions. The sheer volume and liquidity of the Forex market make it an ideal playground for technical traders. The market's 24-hour nature allows for continuous analysis and adaptation to new data.
Trend Following and Breakouts: One of the primary applications of technical analysis is trend following. Traders seek to capitalize on sustained movements by identifying and riding trends using trendlines and channels. Breakout trading is another strategy where traders look for price movements outside of defined support or resistance levels, anticipating a new trend.
Support and Resistance: These are critical concepts in technical analysis, representing psychological barriers. Support levels indicate a price point where a currency pair tends to stop falling and might rebound, while resistance levels indicate a price point where a currency pair stops rising. Identifying these levels helps traders make strategic entry and exit decisions.
Oscillators and Momentum: Oscillators like the RSI and MACD (Moving Average Convergence Divergence) are used to gauge the momentum and strength of a trend. These indicators are particularly useful in range-bound markets, where prices oscillate between support and resistance levels.
Expert Insights and Tools
The use of technical analysis in Forex trading is not merely about understanding indicators and patterns; it also involves the application of sophisticated tools and platforms. Trading platforms such as TradingView offer advanced charting capabilities and a community of traders sharing insights and strategies. These platforms allow traders to backtest strategies, ensuring their robustness before real-world application.
Moreover, continuous education is vital. Platforms like Coursera offer courses that enhance traders' skills in technical analysis, providing them with the ability to read and interpret stock charts, identify trends, and understand complex indicators and oscillators.
Challenges and Considerations
Despite its widespread use, technical analysis is not without its challenges. The Forex market's inherent volatility can sometimes render technical signals unreliable. False breakouts, whipsaws, and market noise can lead to incorrect predictions and losses. Therefore, successful traders often combine technical analysis with other forms of analysis, such as fundamental analysis, to validate their trading decisions.
The subjective nature of chart patterns can also pose a challenge. Different traders might interpret the same chart differently, leading to varying conclusions about the market's direction. This subjectivity underscores the importance of experience and continuous learning in mastering technical analysis.
Conclusion
Technical analysis remains an indispensable tool in the Forex trader's arsenal. By focusing on past price movements and using a combination of charts, patterns, and indicators, traders can develop a structured approach to navigating the complexities of the Forex market. As the market continues to evolve, so too must the strategies and tools used by traders, underscoring the importance of continuous learning and adaptation in the ever-changing landscape of Forex trading.
In conclusion, while technical analysis provides significant insights into market behavior, it should be employed as part of a broader strategy that incorporates various analytical perspectives. This holistic approach allows traders to mitigate risks and enhance their decision-making capabilities, ultimately leading to more successful trading outcomes.