Advanced Technical Analysis of NASDAQ:AMD – Potential Rebound and Price Targets in Mid-2025
Advanced Micro Devices (NASDAQ:AMD) has been exhibiting a notable price consolidation in recent weeks, positioning itself for a possible technical rebound as the semiconductor sector navigates evolving market dynamics. Trading near $144.42 as of July 14, 2025, AMD’s chart patterns and key technical indicators suggest tactical opportunities for investors with a 2–4 week investment horizon.
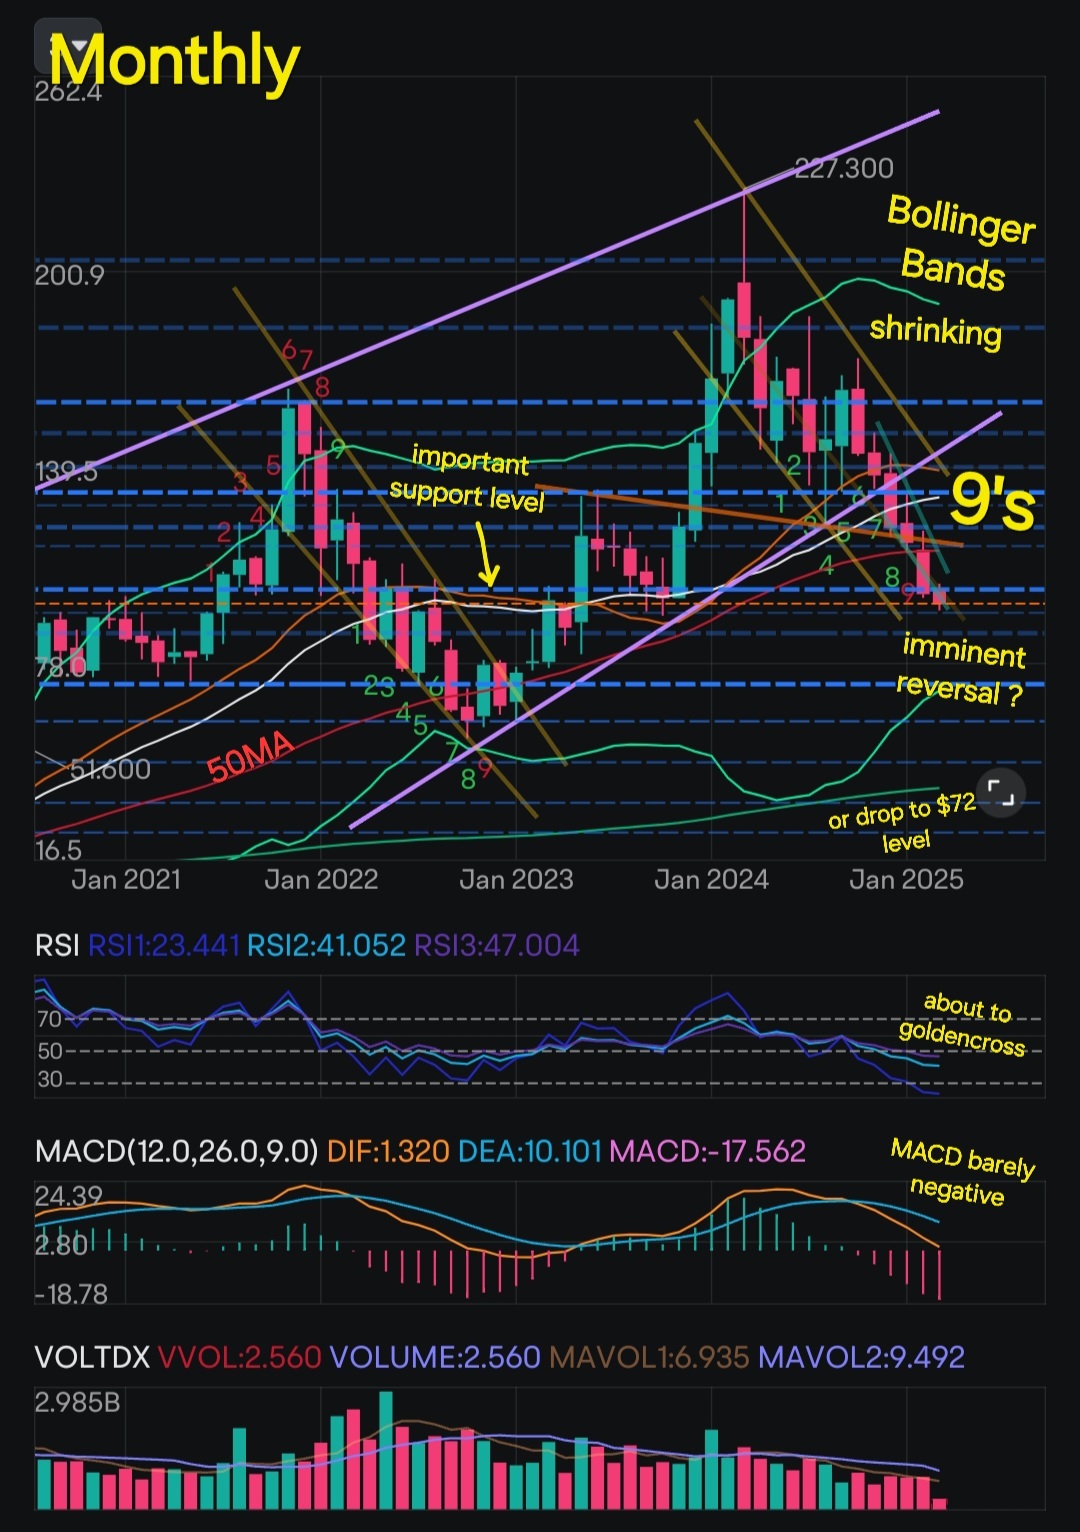
Technical Landscape: Consolidation and Key Levels
AMD’s price action over the past month has formed a classic consolidation range, with the stock repeatedly testing a critical support zone at approximately $120.78. This level has acted as a robust floor, absorbing selling pressure amid broader semiconductor sector volatility driven by supply chain normalization and geopolitical uncertainties.
On the upside, Fibonacci expansion analysis provides clear benchmark targets that traders and investors often use to gauge potential breakout strength:
- 1.236 Fibonacci Extension: $164.54
- 1.382 Fibonacci Extension: $174.98
These extension levels indicate price points where momentum-driven rallies could face resistance but also serve as potential profit-taking zones or areas for reassessment.
Market Context and Sector Dynamics
The semiconductor industry remains in a state of tactical recalibration. The easing of supply chain constraints has helped stabilize inventory levels, while demand for high-performance computing in PC and data center segments shows signs of recovery. AMD’s strategic product pipeline, including next-generation CPUs and GPUs, as well as its partnerships in the AI and cloud infrastructure space, underpin its growth narrative.
Furthermore, geopolitical challenges—such as U.S.-China technology tensions—continue to inject episodic volatility into chipmakers’ stock prices. However, AMD’s diversified market exposure and innovation focus provide a defensive cushion relative to peers.
Investment Implications: Tactical Positioning and Risk Management
For investors and technical traders, AMD’s current setup offers a compelling risk-reward profile, provided prudent risk controls are employed. Key tactical considerations include:
- Entry Points: Positions near the $120.78 support offer reduced downside risk and favorable reward potential if price rebounds materialize.
- Stop-Loss Strategies: Placing stops just below the support zone helps manage downside exposure amid sector uncertainties.
- Profit Targets: The Fibonacci extension levels at $164.54 and $174.98 provide actionable price targets for scaling out of positions or re-evaluating momentum.
- Time Horizon: A 2–4 week window aligns with expected event-driven catalysts, such as upcoming earnings reports, product announcements, or sector data releases.
Continuous attention to trading volumes and price momentum indicators can help validate the strength of any breakout or breakdown.
Conclusion: Navigating AMD’s Mid-2025 Technical Setup
AMD’s recent consolidation signals a stock coiling for a potential technical re-launch. The support at $120.78 anchors a floor for tactical entries, while Fibonacci expansion targets near $165 and $175 mark meaningful upside objectives. Investors integrating sector fundamentals with technical cues can position to capitalize on semiconductor sector momentum shifts.
Nonetheless, a disciplined approach—monitoring volume, price action, and broader semiconductor indices—is essential for optimizing entry and exit points. The interplay of AMD’s innovation pipeline, geopolitical factors, and macroeconomic trends will continue to influence price trajectories in the near term.
References
- TradingView: Silicon Whiplash – AMD Coiling for a Re-Launch
- NASDAQ Market Data
All data and analysis are current as of July 14, 2025.